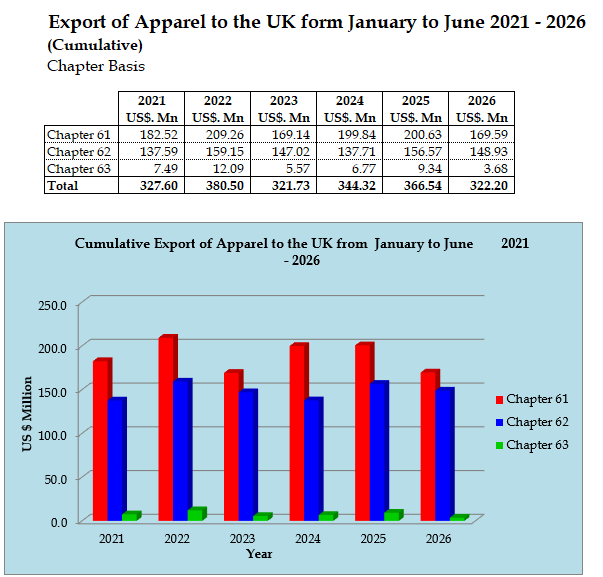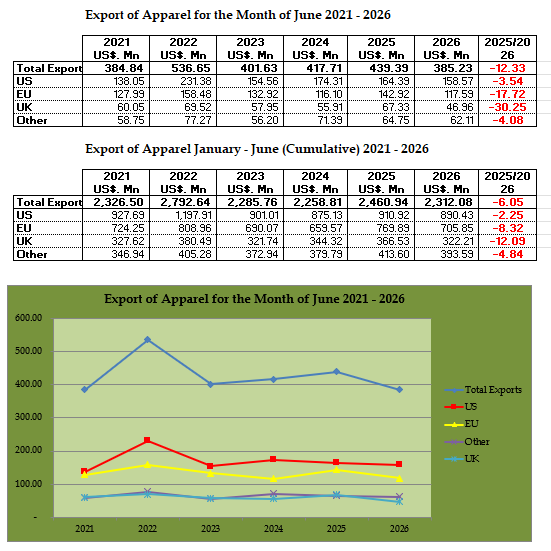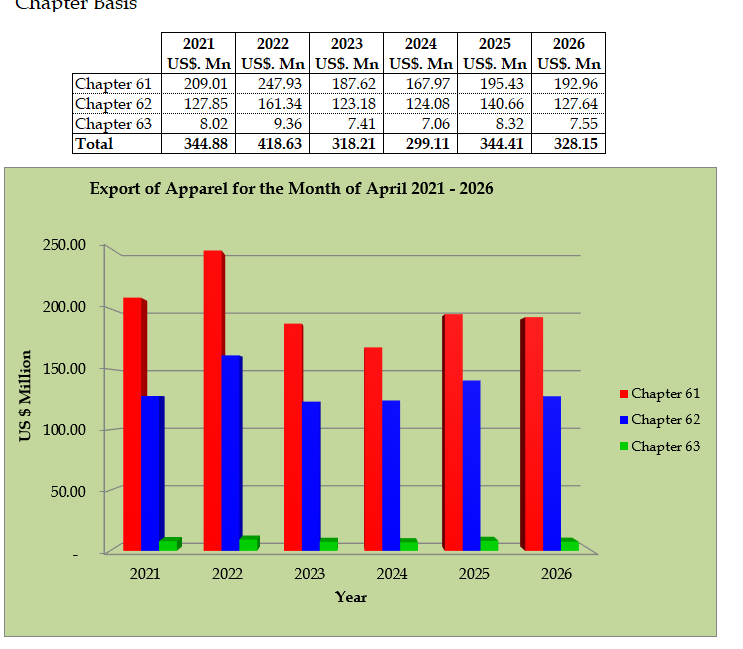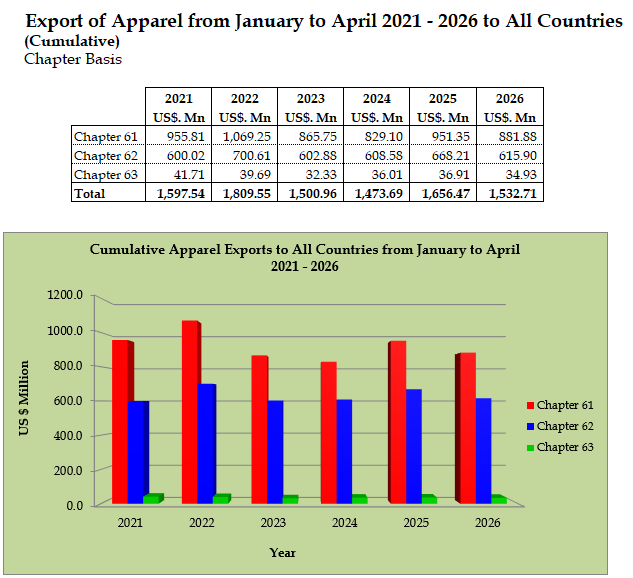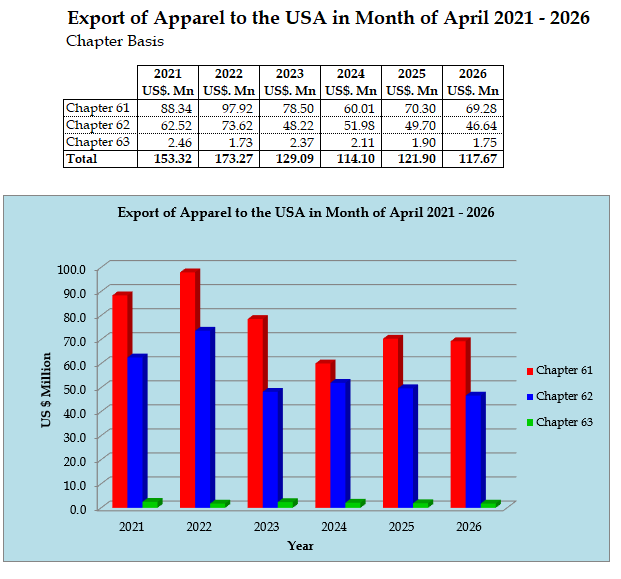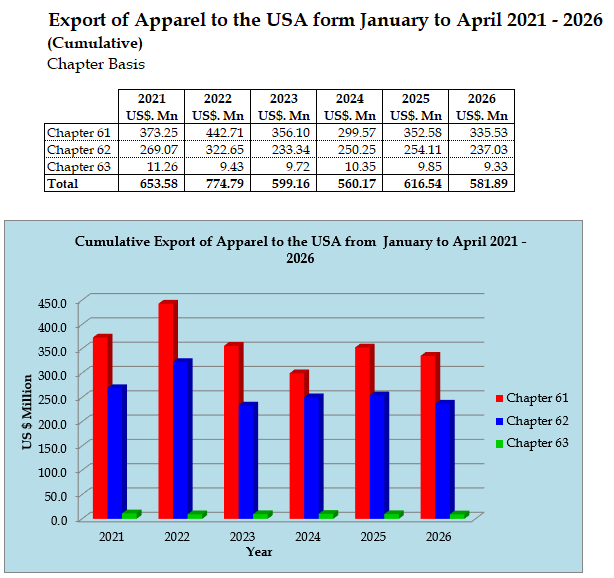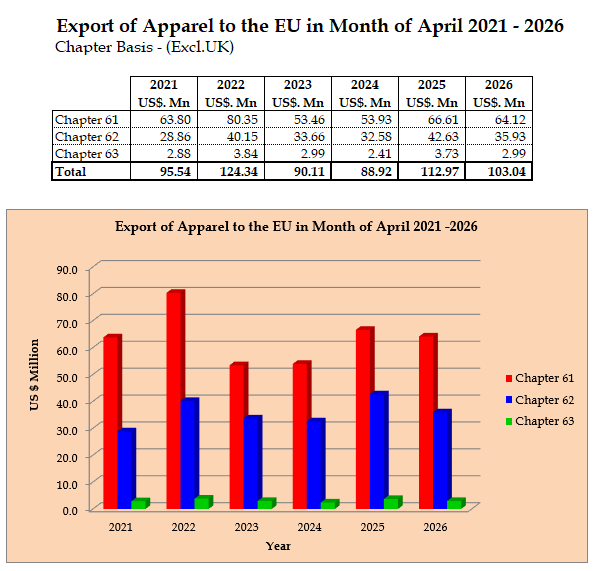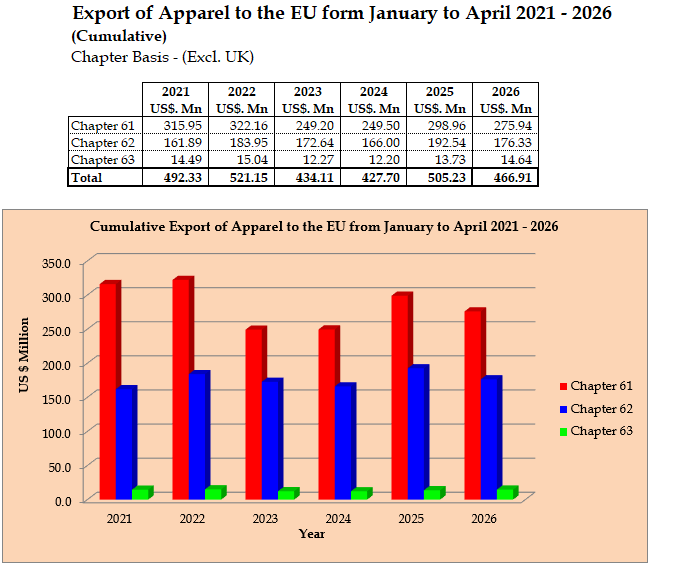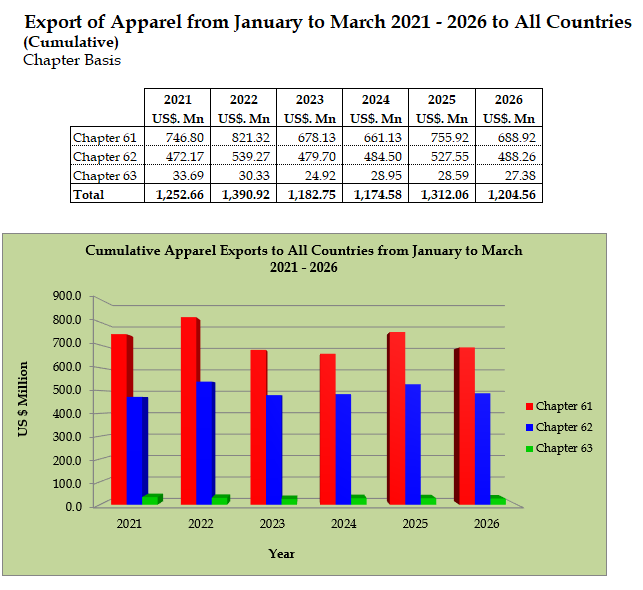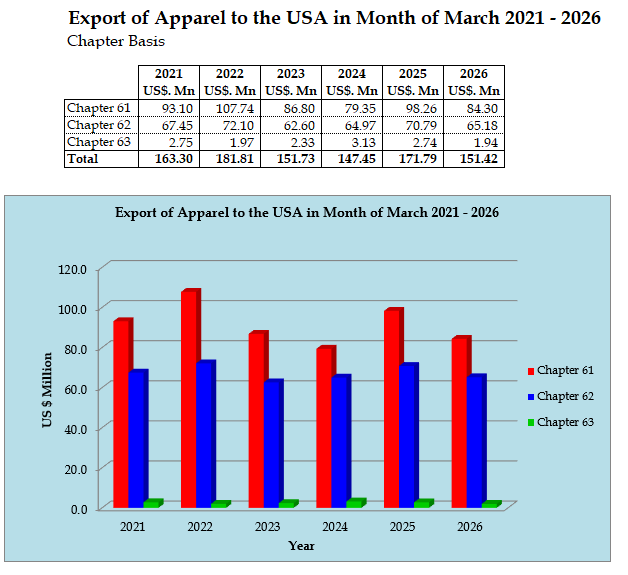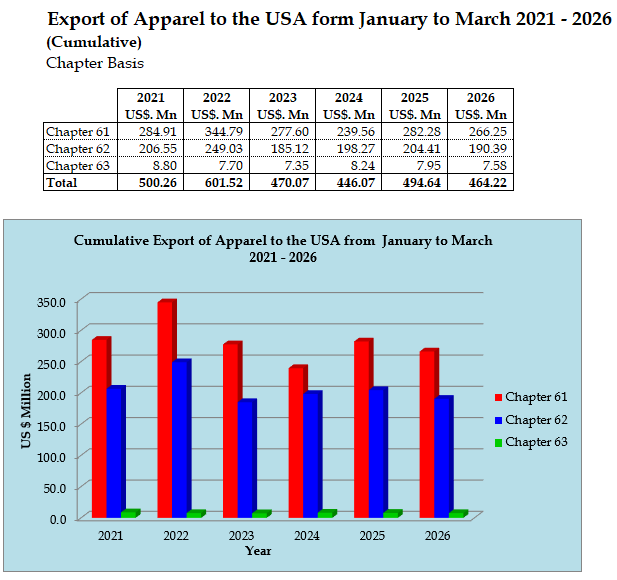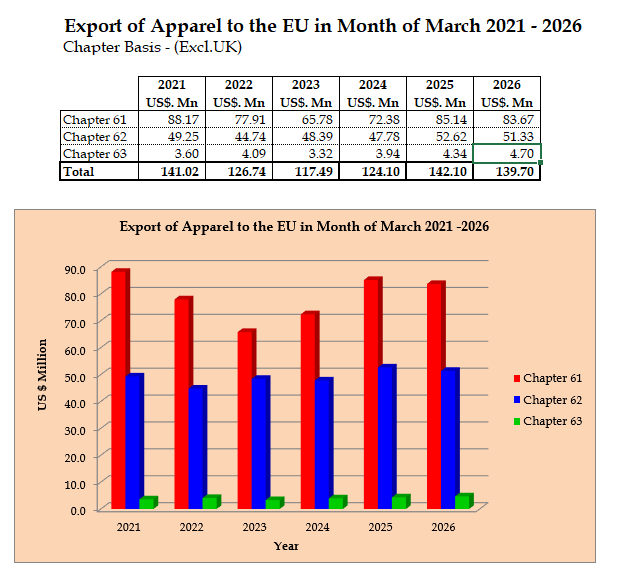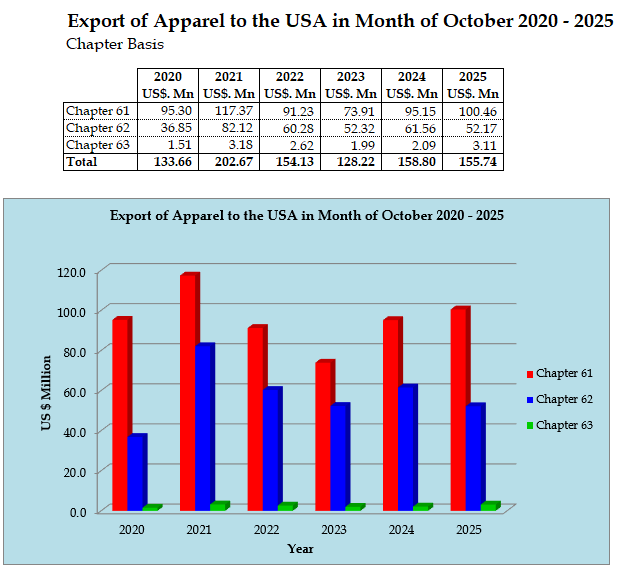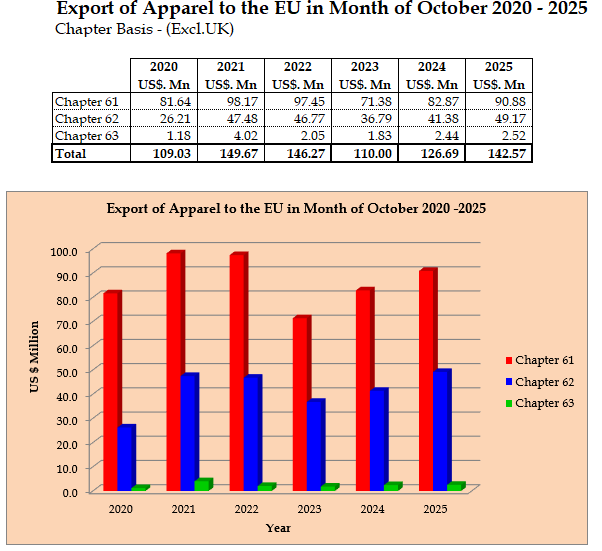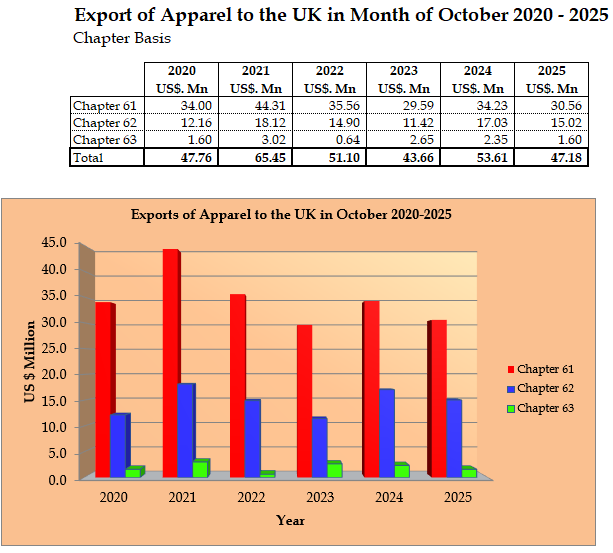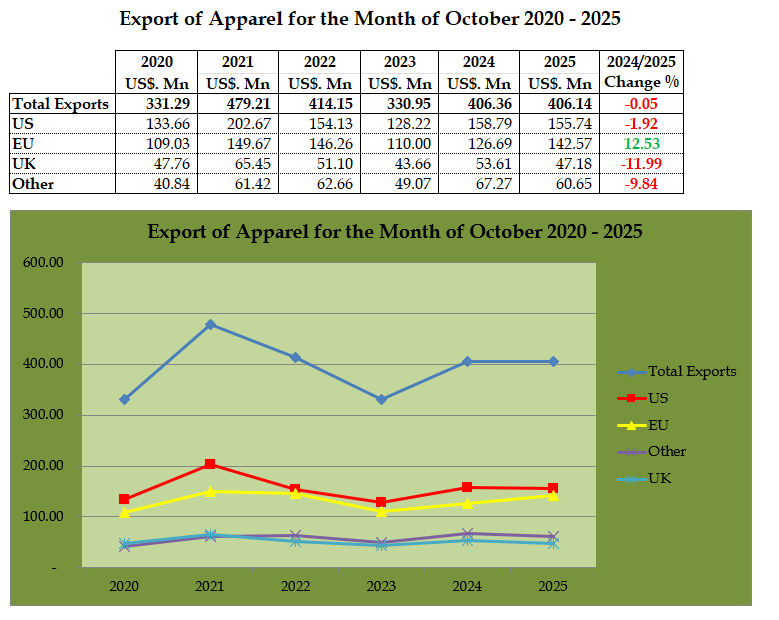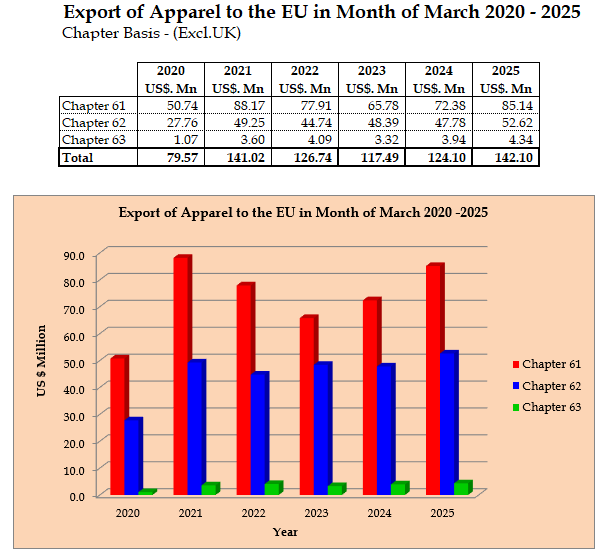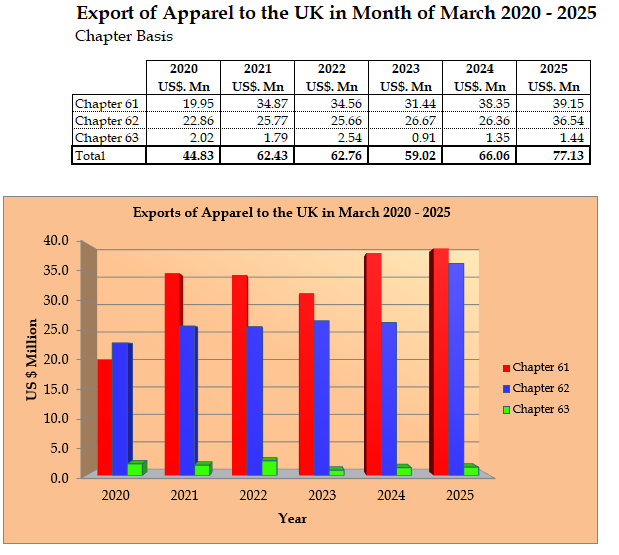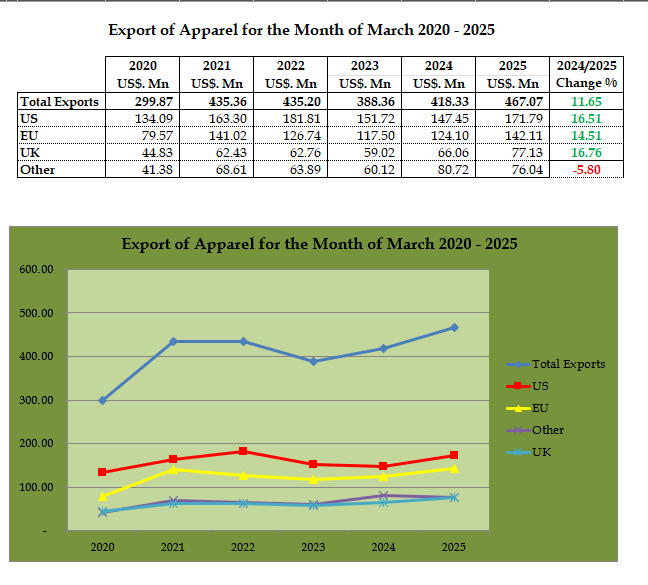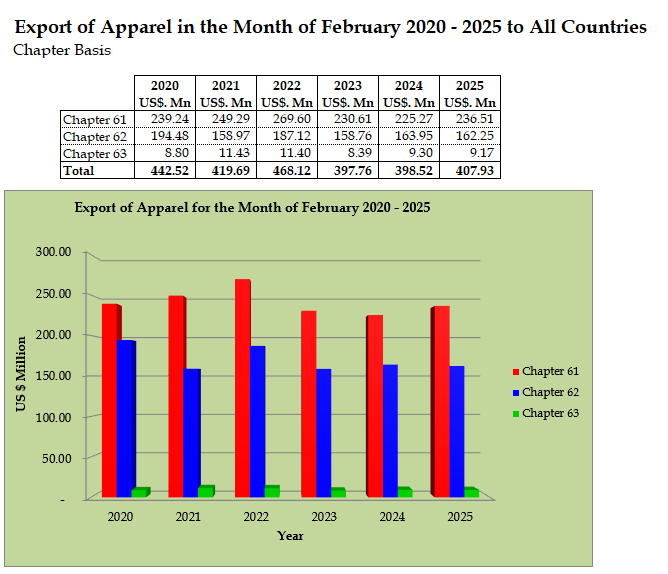
For a complete breakdown of cross-country apparel import trends, regional comparisons, and granular monthly data across the US, EU, and UK markets, please refer to the full report linked below:
https://srilankaapparelsourcing.com/wp-content/uploads/2026/10/Comparison-of-imports-by-US-EU-UK-from-SL-Bang-China-India-Vietnam-Cambodia-Indonesia-August-2026.xlsx
Executive Summary: Sri Lanka Apparel Exports (Jan – Aug 2026)
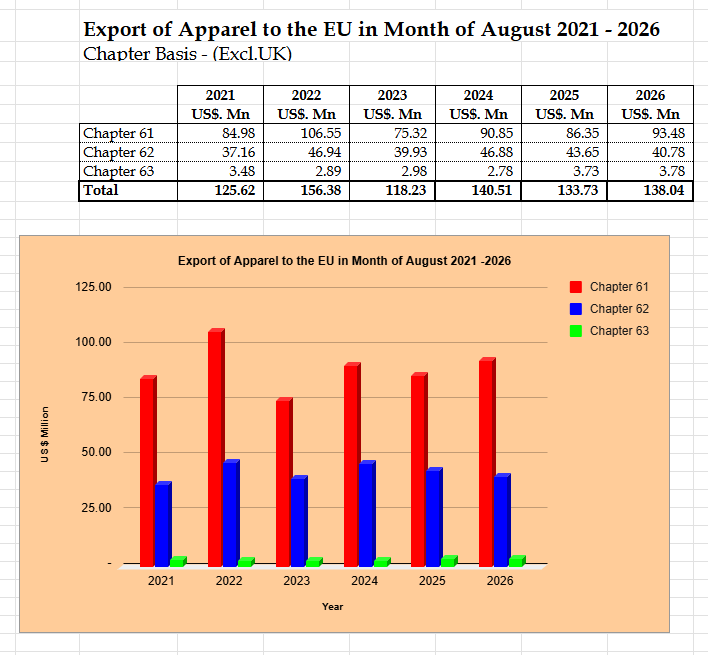
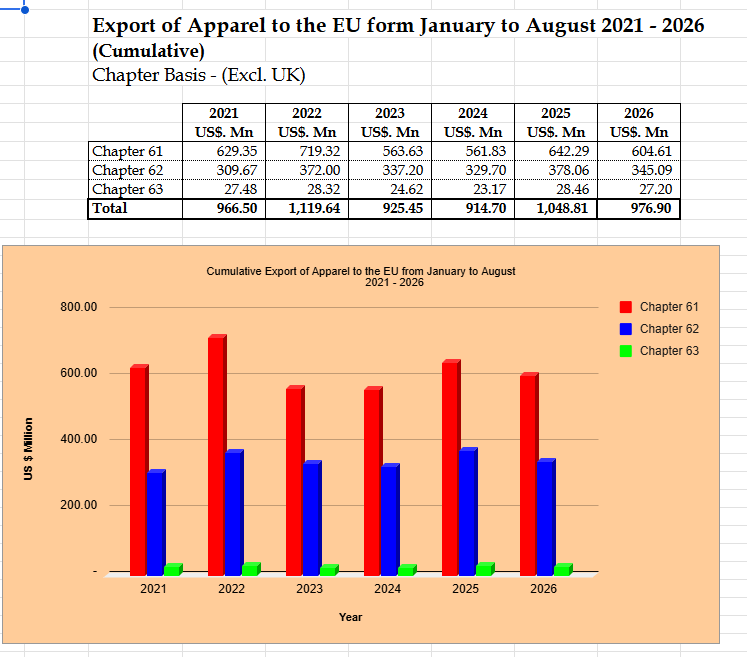
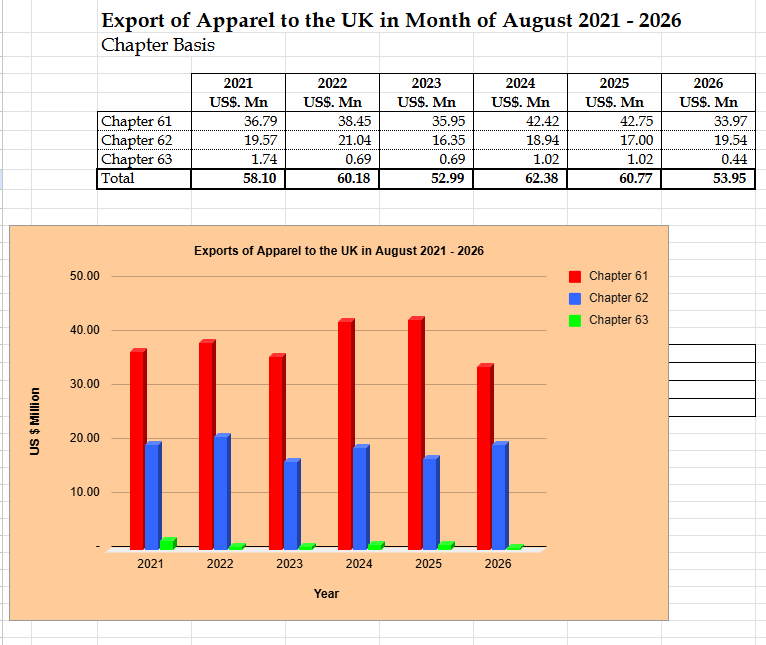
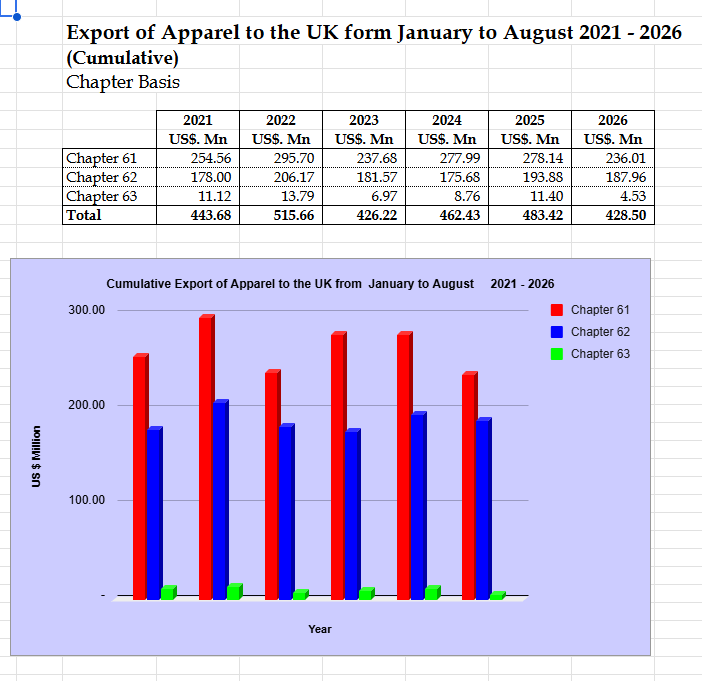
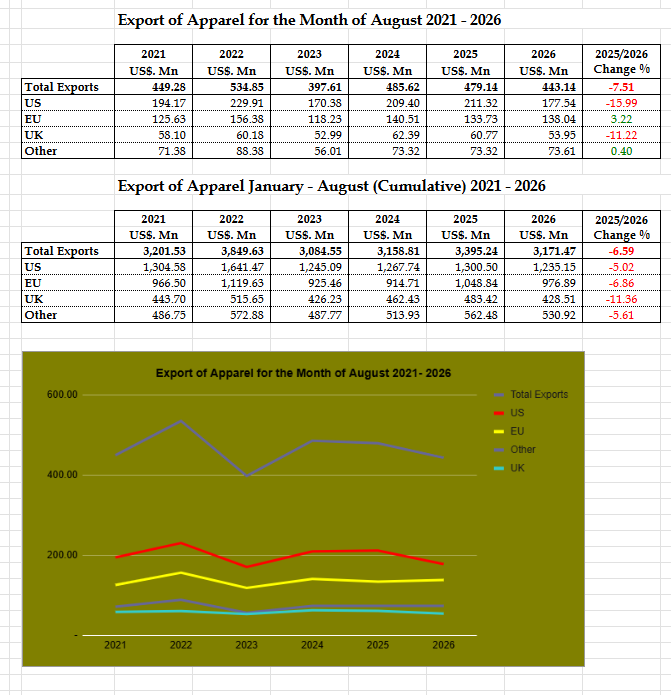
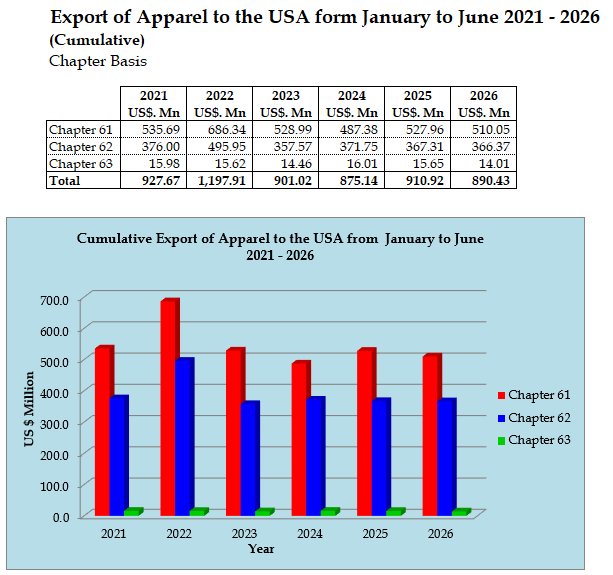
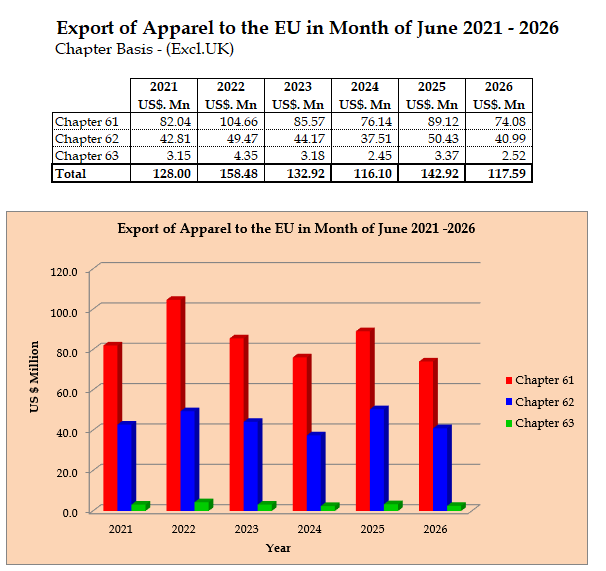
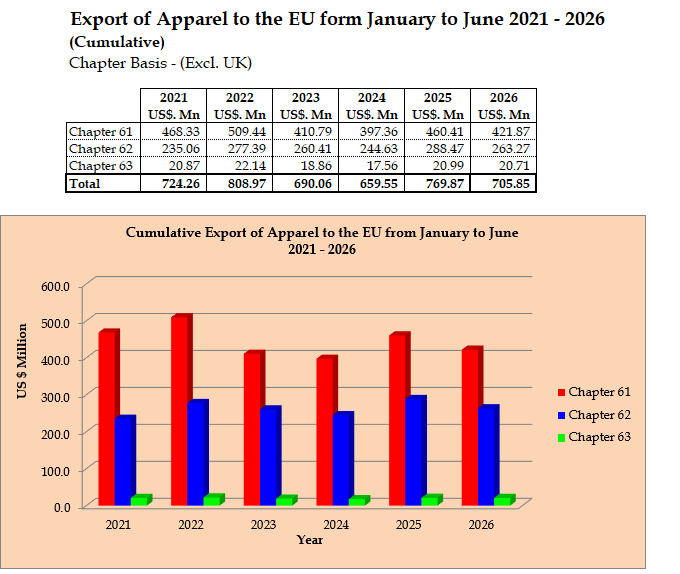
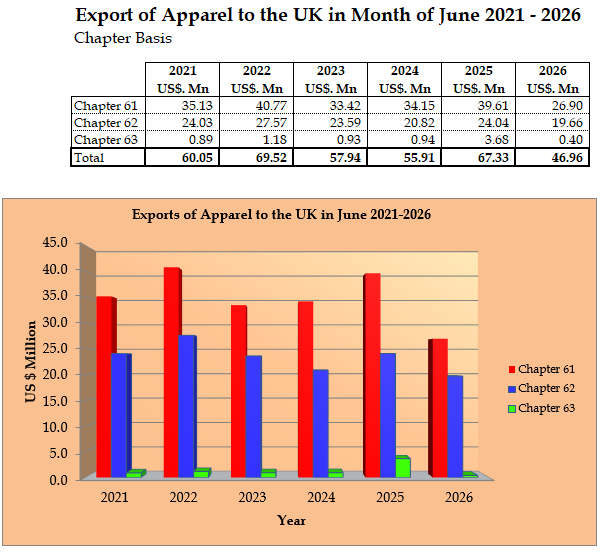
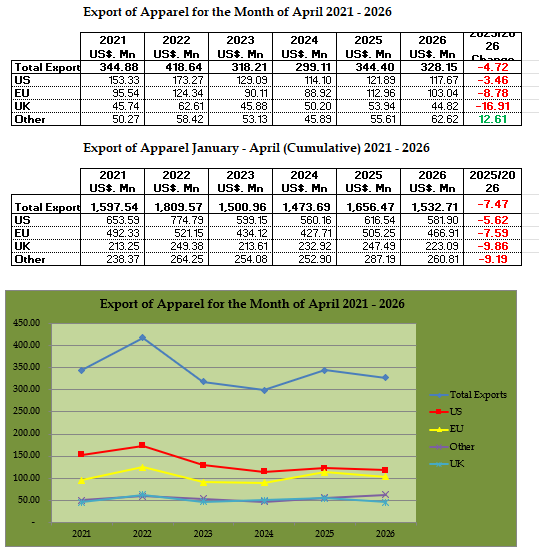
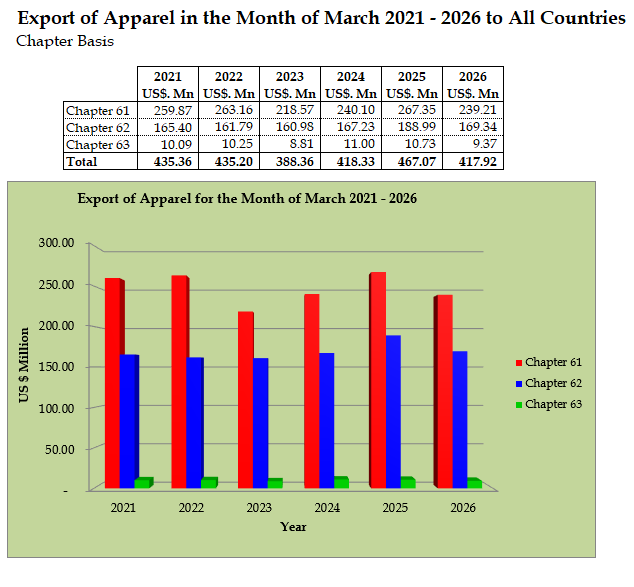
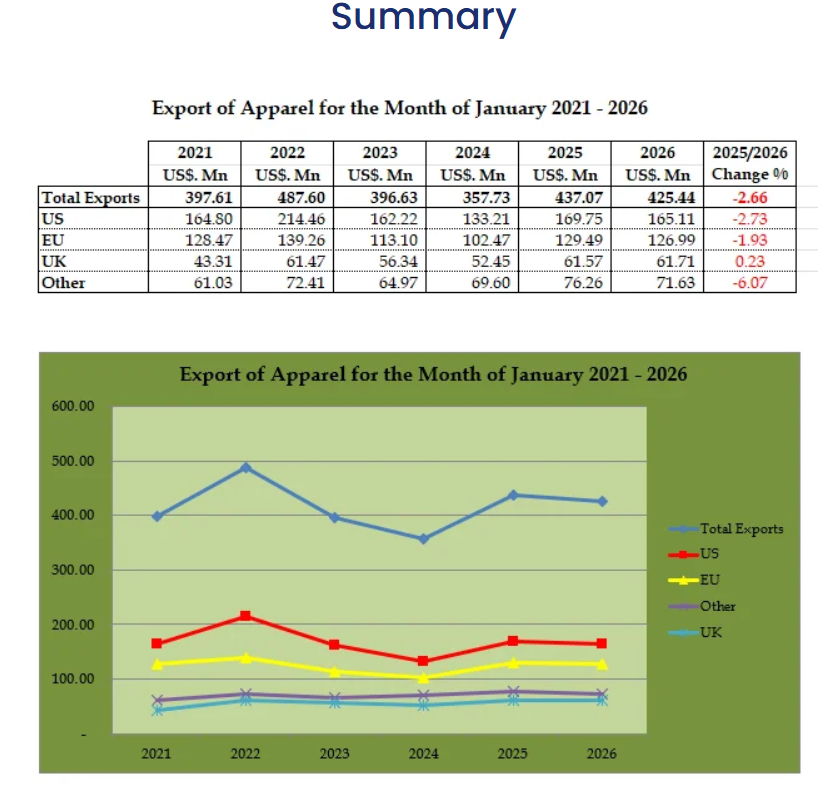
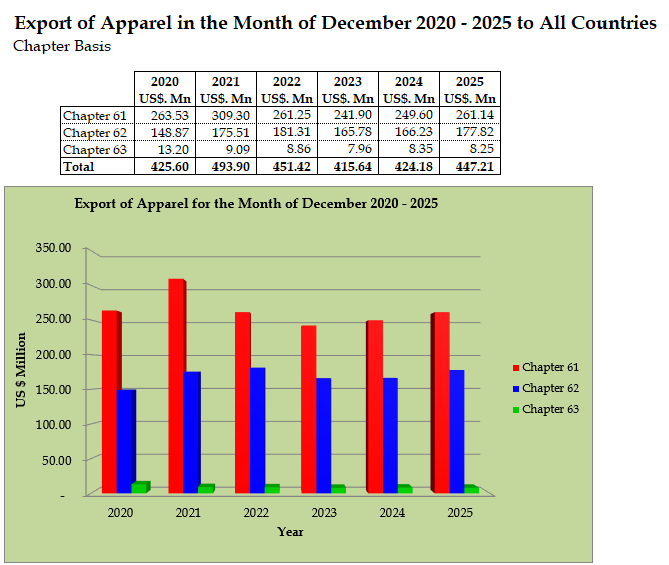
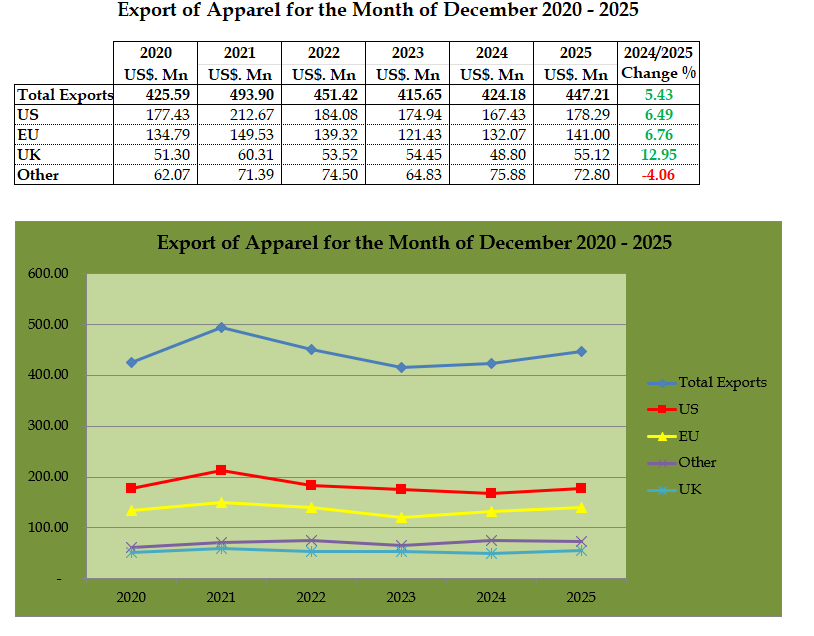
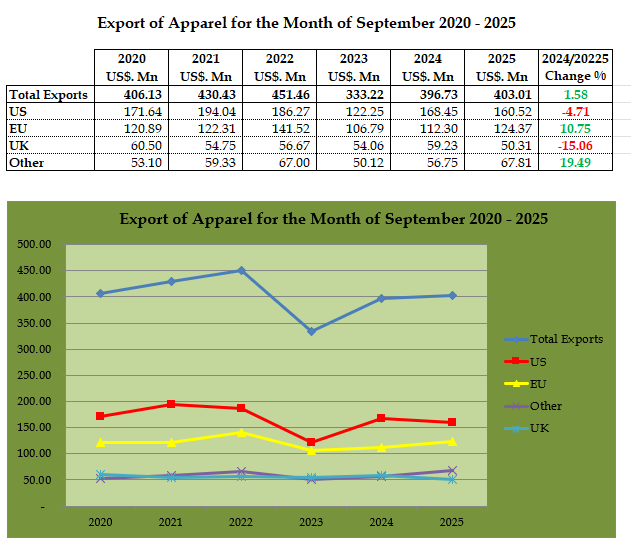
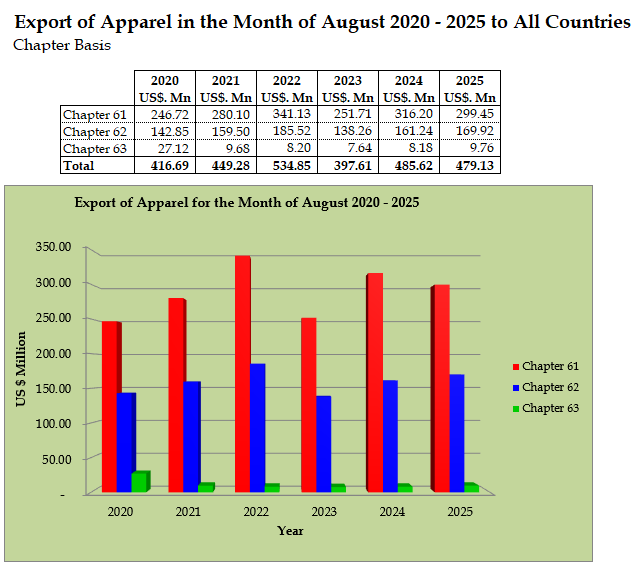
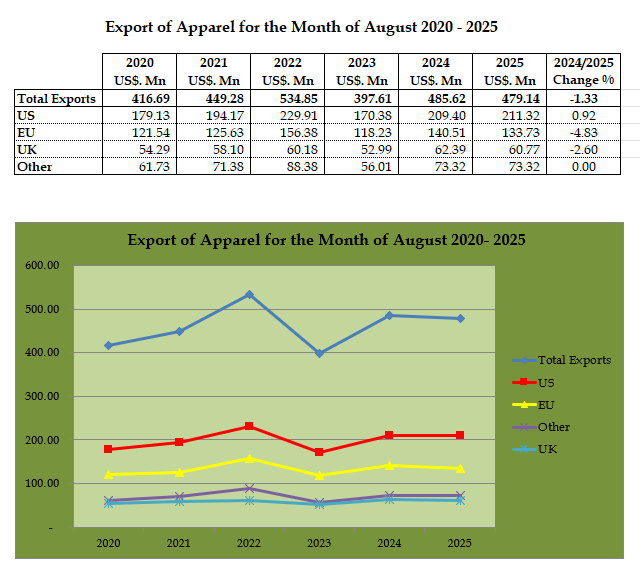
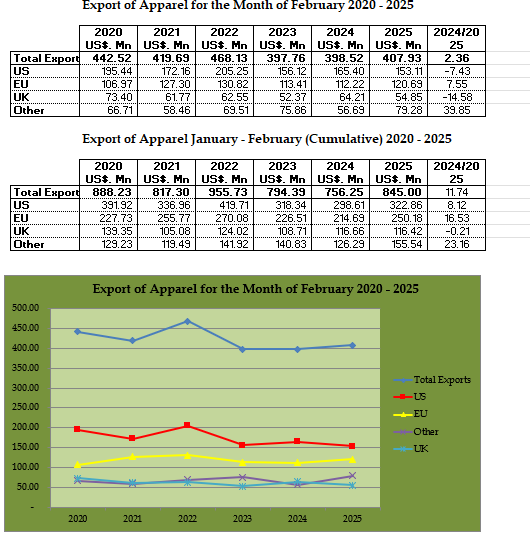
During the first eight months of 2026, Sri Lanka’s total apparel exports to its major markets (US, EU, and UK) reached $2,500.09 Million, representing a -6.47% YoY contraction compared to $2,673.13 Million in 2025.
Key Market Summary (USD Millions)
| Market | Jan–Aug 2025 | Jan–Aug 2026 | YTD Change (%) | Aug 2025 | Aug 2026 | Aug Change (%) |
|---|---|---|---|---|---|---|
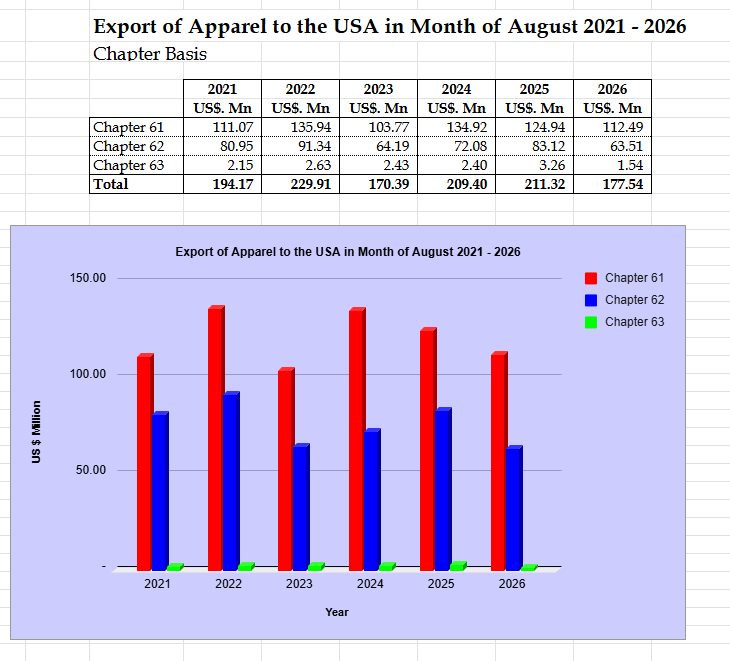
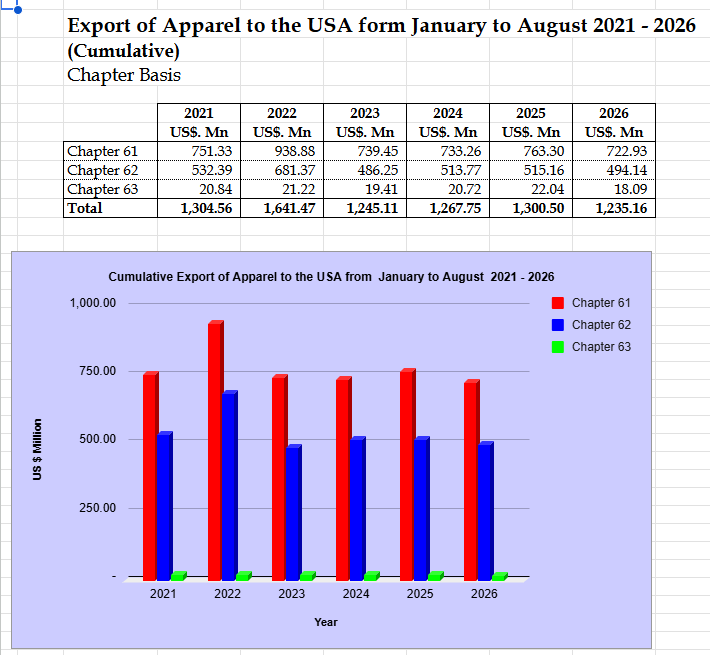
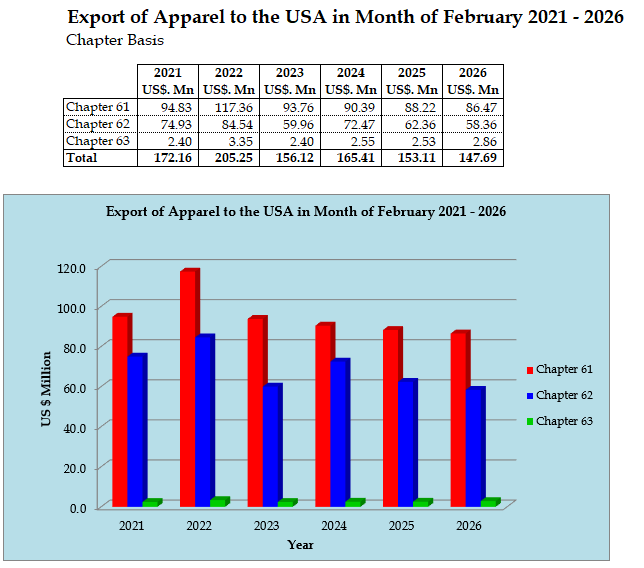
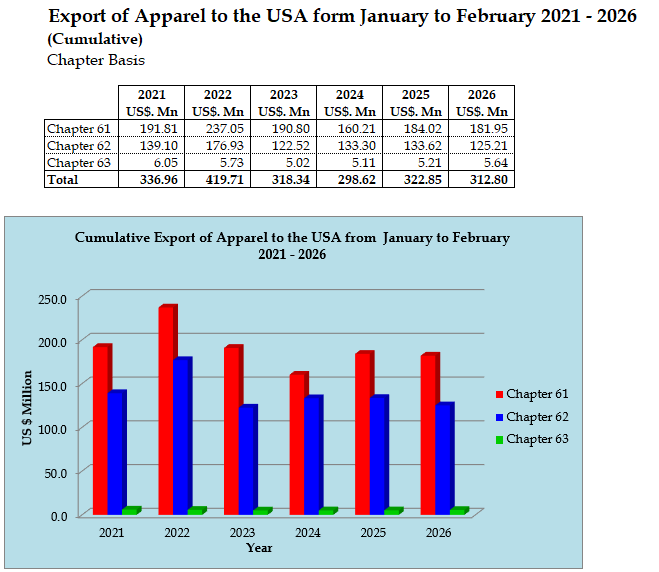
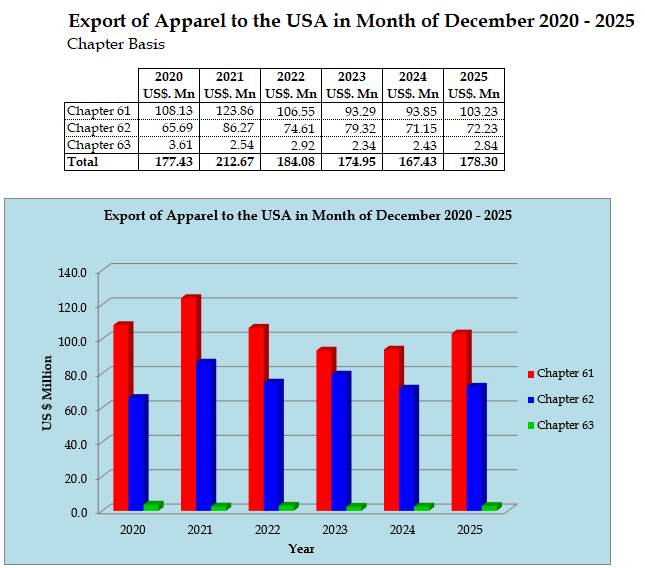
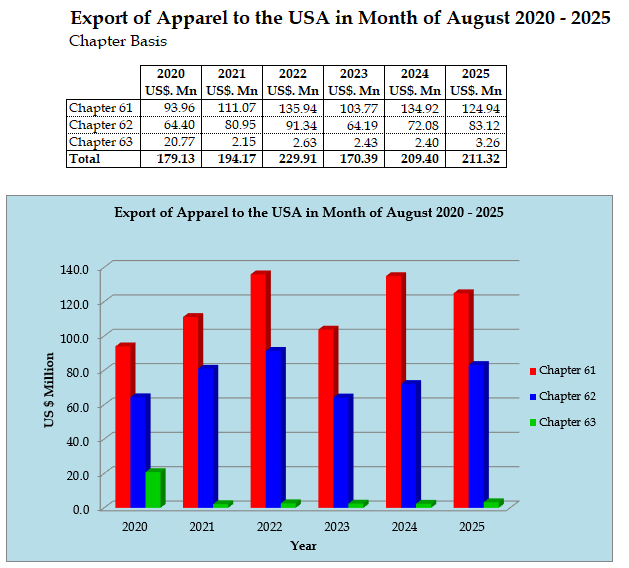
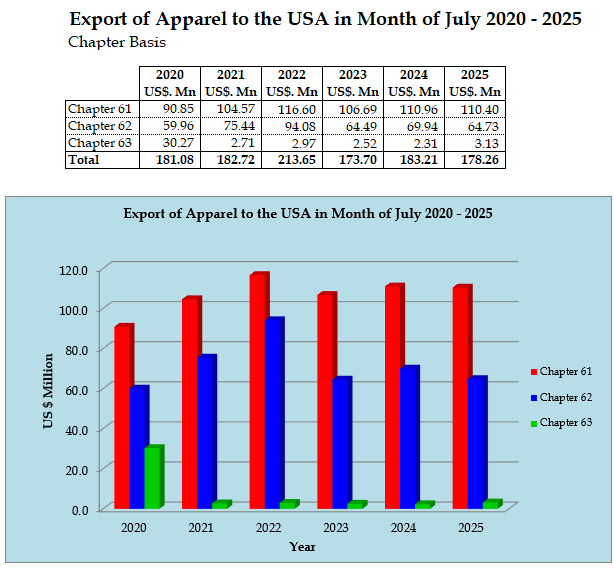
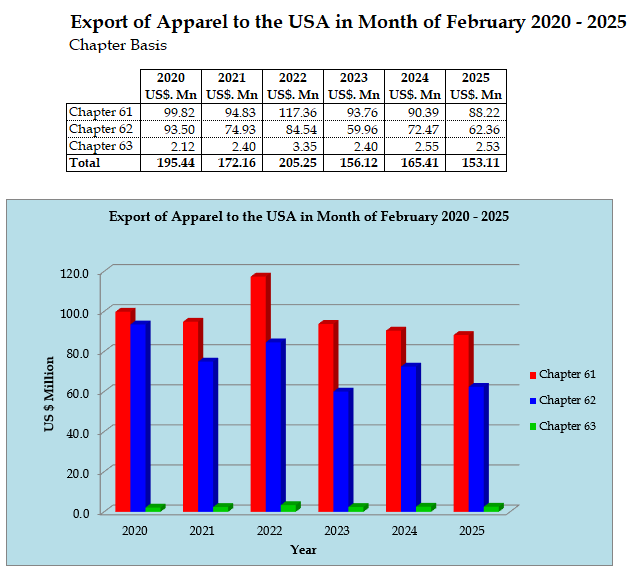
| USA | $1,197.13M | $1,167.32M | -2.49% | $162.82M | $160.78M | -1.26% |
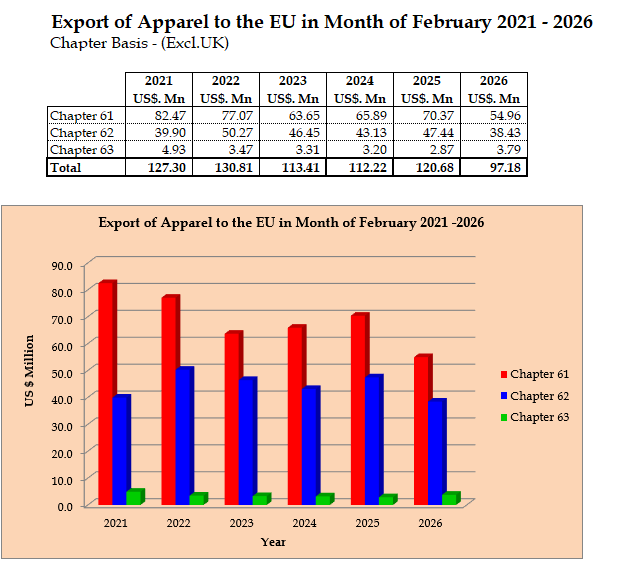
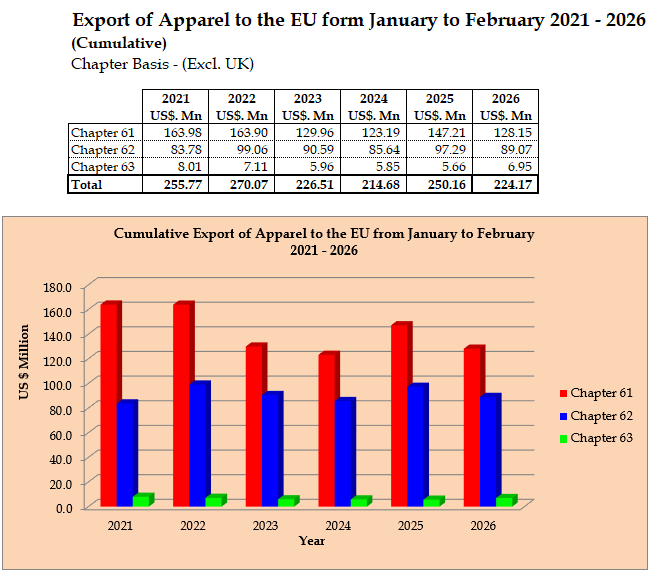
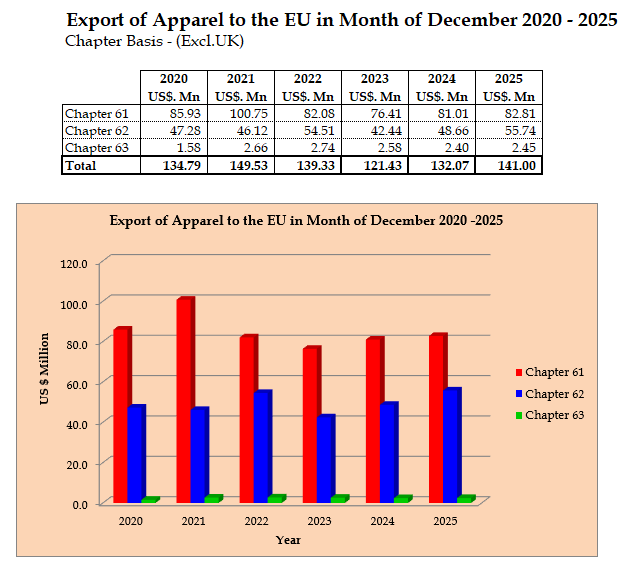
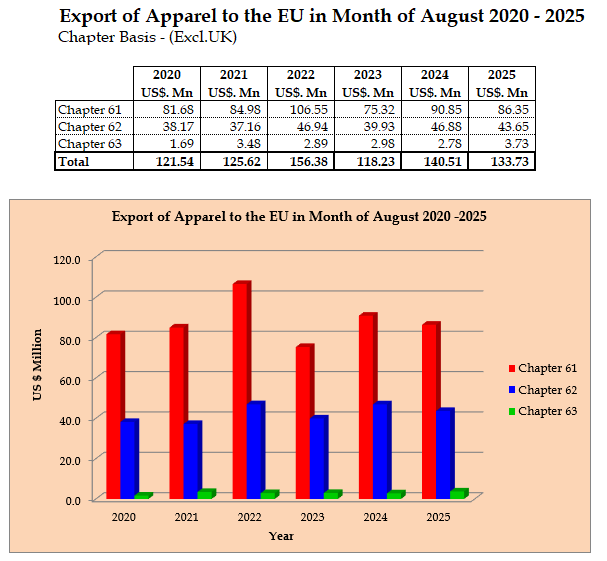
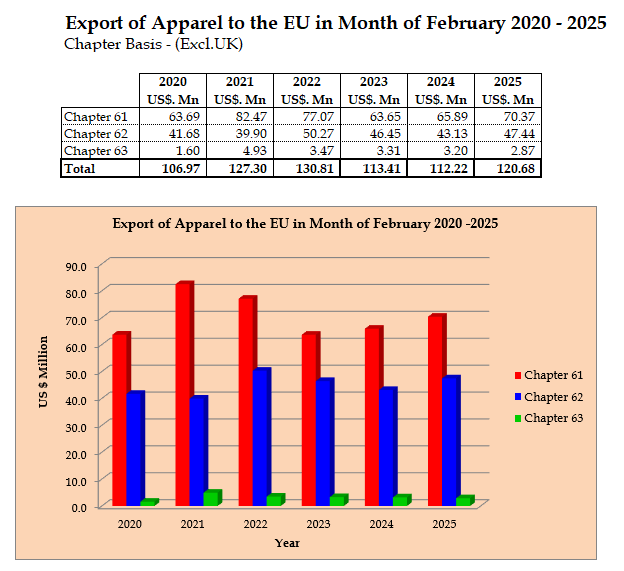
| EU | $1,056.08M | $979.76M | -7.23% | $135.98M | $120.58M | -11.32% |
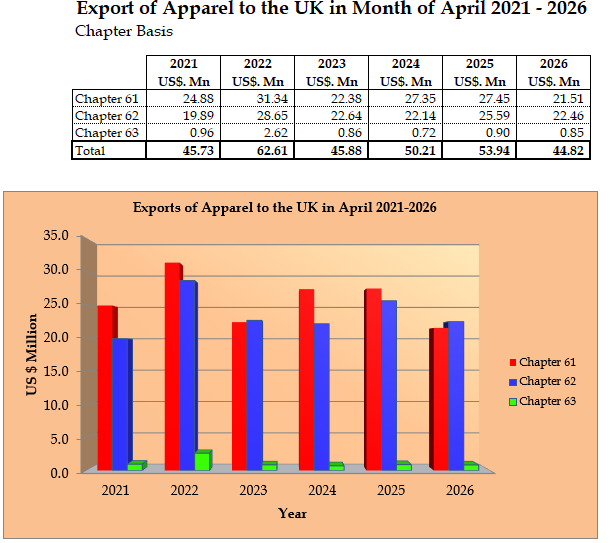
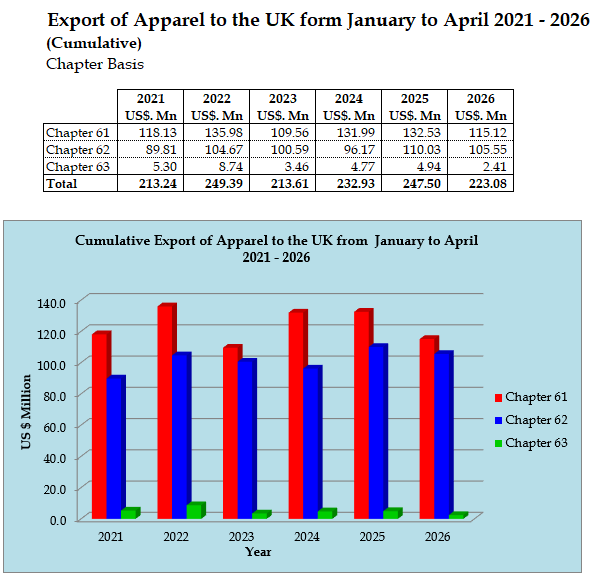
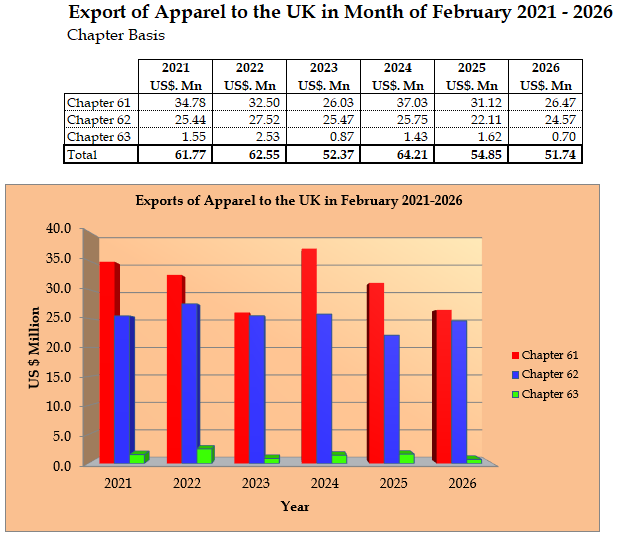
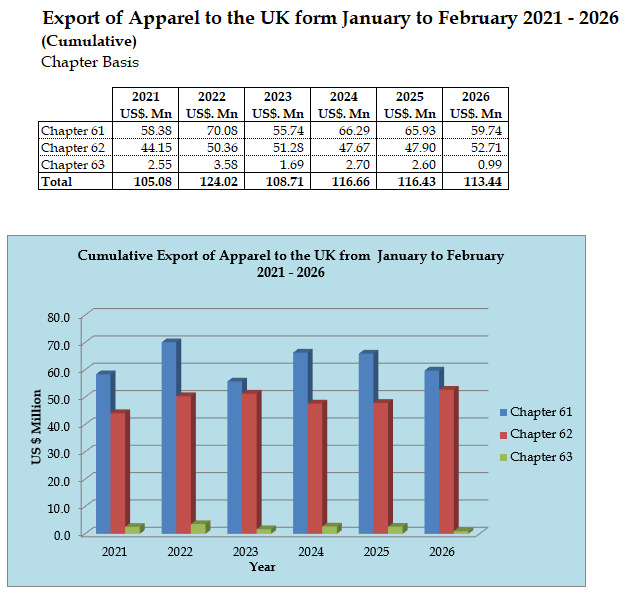
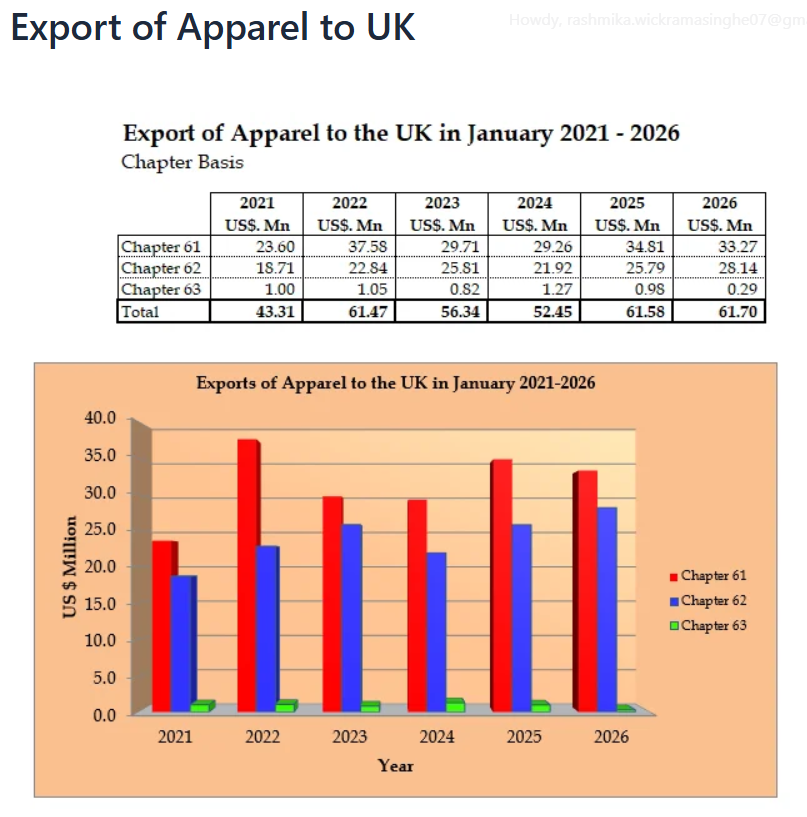
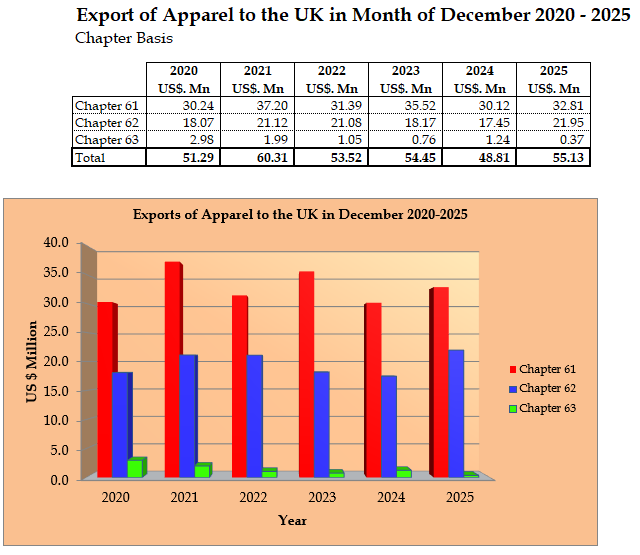
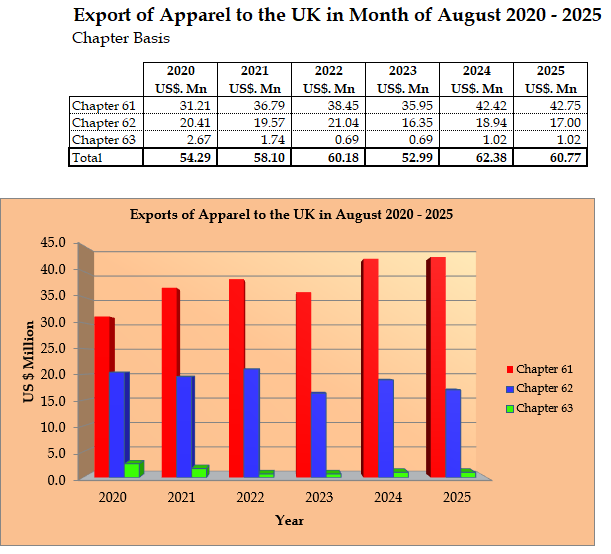
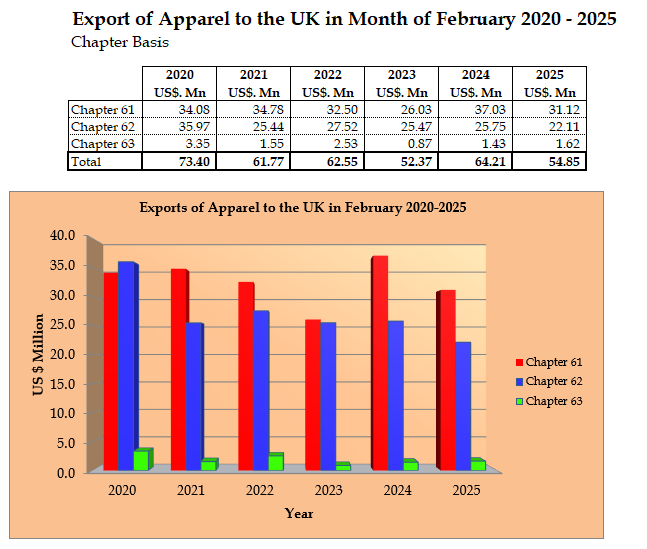
| UK | $419.92M | $353.01M | -15.93% | $56.91M | $40.81M | -28.29% |
| Total | $2,673.13M | $2,500.09M | -6.47% | $355.71M | $322.17M | -9.43% |
Regional YTD Competitor Benchmarking (Jan – Aug 2026 vs 2025)
| Country | US Market Growth | EU Market Growth | UK Market Growth |
|---|---|---|---|
| Sri Lanka | -2.49% | -7.23% | -15.93% |
| Bangladesh | -3.98% | -7.35% | -2.16% |
| China | -23.69% | +11.29% | -3.31% |
| India | -23.90% | -5.61% | +2.42% |
| Vietnam | +1.01% | +8.27% | +2.80% |
| Cambodia | +9.79% | +0.11% | -6.26% |
| Indonesia | +2.34% | -6.12% | -6.82% |